80 - Locations on Geomap
Plotting geocoded Named Entities on a map.
Geocoded Named Entities can easily be mapped on a geographical map. There are several services and libraries to do the job:
- With a Mapbox account (50k web map loads/month free tier) you can plot your coordinates from a Pandas dataframe to a Plotly scatter-mapbox.
- GeoPandas makes working with geospatial data in python easier. It extends the datatypes used by Pandas to allow spatial operations on geometric types.
- Folium creates beautiful and interactive maps by using Python and Leaflet, a JavaScript library for interactive maps. Folium has a lot of Jupyter demo notebooks.
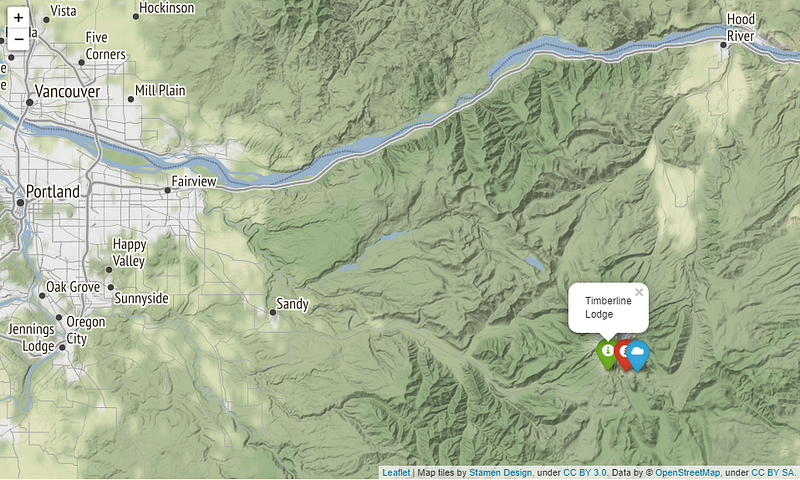
Folium chart with Python and Leaflet (source)
This article is part of the project Periodic Table of NLP Tasks. Click to read more about the making of the Periodic Table and the project to systemize NLP tasks.